图书简介
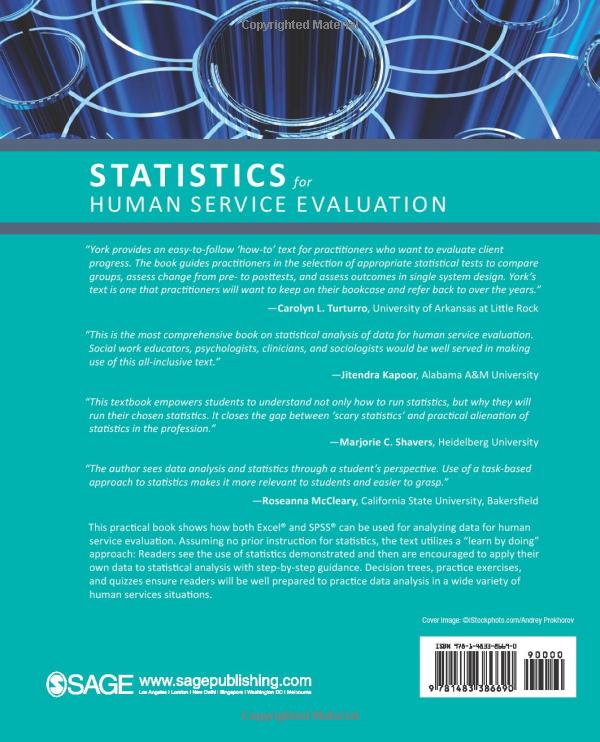
A practical book that shows how both Excel® and SPSS® can be used for analyzing data for human service evaluation.
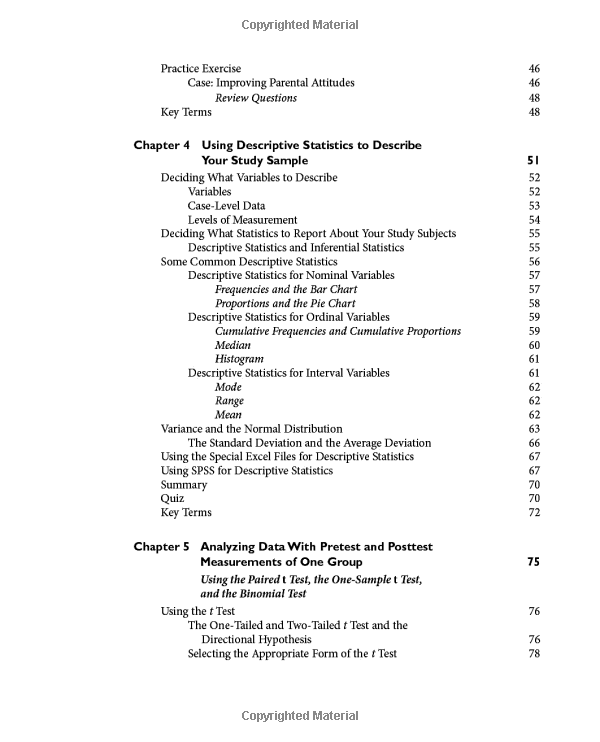
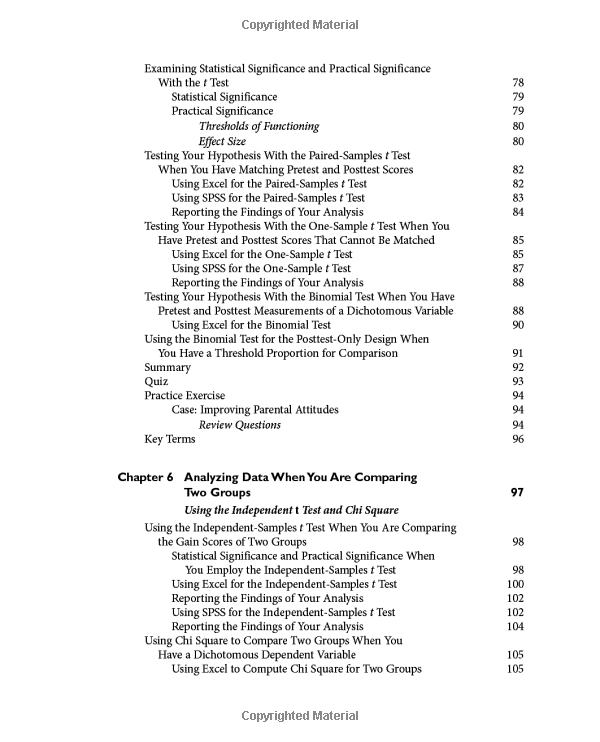
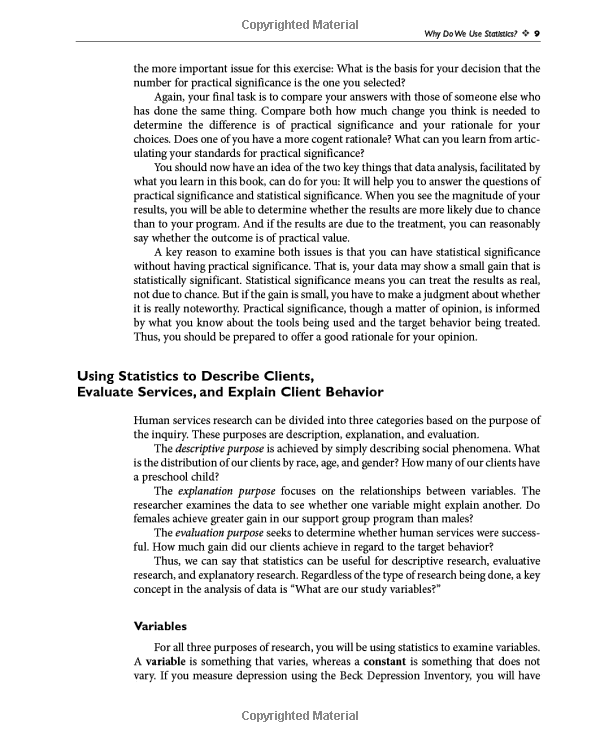
Preface \\ Acknowledgments \\ About the Author \\ Chapter 1 Why Do We Use Statistics? \\ Why We Use Statistics \\ What You Will Find in the Rest of This Chapter \\ Two Key Issues Addressed by Data Analysis—Practical Significance and Statistical Significance \\ Using Statistics to Describe Clients, Evaluate Services, and Explain Client Behavior \\ Descriptive and Inferential Statistics \\ How Do We Analyze Data the User-Friendly Way? \\ What You Will Learn From This Book \\ Quiz \\ Key Terms \\ Chapter 2 Using the Computer for Statistical Analysis of Data \\ Using Excel for Statistical Analysis \\ Using SPSS for Statistical Analysis \\ The Structure of Excel and SPSS for Data Analysis \\ Using Excel in a User-Friendly Approach to Data Analysis— An Illustration \\ Reporting Your Findings \\ Summary of How to Use Excel \\ Quiz \\ Chapter 3 Selecting a Statistic to Answer Your Research Question \\ Finding a Descriptive Statistic \\ Finding a Statistic to Test Your Hypothesis in Evaluative Research \\ The Study Hypothesis \\ Things to Do Before You Seek a Statistic for an Evaluative Hypothesis \\ Finding Your Statistic for Testing the Evaluative Research Hypothesis: One Example \\ Practice Exercise \\ Key Terms \\ Chapter 4 Using Descriptive Statistics to Describe Your Study Sample \\ Deciding What Variables to Describe \\ Deciding What Statistics to Report About Your Study Subjects \\ Some Common Descriptive Statistics \\ Variance and the Normal Distribution \\ Using the Special Excel Files for Descriptive Statistics \\ Using SPSS for Descriptive Statistics \\ Summary \\ Quiz \\ Key Terms \\ Chapter 5 Analyzing Data With Pretest and Posttest Measurements of One Group \\ Using the t Test \\ Examining Statistical Significance and Practical Significance With the t Test \\ Testing Your Hypothesis With the Paired-Samples t Test When You Have Matching Pretest and Posttest Scores \\ Testing Your Hypothesis With the One-Sample t Test When You Have Pretest and Posttest Scores That Cannot Be Matched \\ Testing Your Hypothesis With the Binomial Test When You Have Pretest and Posttest Measurements of a Dichotomous Variable \\ Using the Binomial Test for the Posttest-Only Design When You Have a Threshold Proportion for Comparison \\ Summary \\ Quiz \\ Practice Exercise \\ Key Terms \\ Chapter 6 Analyzing Data When You Are Comparing Two Groups \\ Using the Independent-Samples t Test When You Are Comparing the Gain Scores of Two Groups \\ Using Chi Square to Compare Two Groups When You Have a Dichotomous Dependent Variable \\ Quiz \\ Practice Exercise \\ Key Terms \\ Chapter 7 Analyzing Data When You Are Evaluating a Single Client \\ Using the One-Sample t Test When You Have a Single Baseline Score and Several Treatment Scores \\ Using the Standard Deviation Approach When You Have Several Baseline Scores and Several Treatment Scores \\ Using Other Single-Subject Designs With Data Measured at the Interval Level \\ Using the Binomial Test for the AB Design When Data Are Measured as a Dichotomy \\ Quiz \\ Practice Exercise \\ Key Terms \\ Chapter 8 Explaining Client Gain \\ Examining the Relationship Between Client Gain and a Variable Measured at the Nominal Level \\ Examining the Relationship Between Client Gain and a Variable Measured at the Interval or Ordinal Level \\ Using Multiple Regression Analysis to Examine the Relationship Between Client Gain Scores and More Than One Other Variable \\ Quiz \\ Practice Exercise: Youth Diversion Program \\ Key Terms \\ Chapter 9 A Synopsis of Selected Statistical Tests for Examining Nominal Data \\ Chi Square and the Binomial Test: A Review \\ Examination of the Relationship Between Two Nominal Variables With Independent Data Using Chi Square, the Phi Coefficient, and the Contingency Coefficient \\ Examination of the Relationship Between Two Nominal Variables With Related Data Using the McNemar Test \\ Using the Binomial Test to Compare the Categories of a Dichotomous Variable \\ Key Terms \\ Chapter 10 A Synopsis of Selected Statistical Tests for Examining Ordinal Data \\ Using the Spearman Rank Correlation Coefficient When You Have Two Ordinal Variables \\ Using the Mann–Whitney U Test When You Have Independent Data With One Ordinal Variable and a Dichotomous Nominal Variable \\ Using the Wilcoxon Matched-Pairs Signed Ranks Test When You Have Related Data With a Dichotomous Variable and an Ordinal Variable \\ Using the Kruskal–Wallis One-Way Analysis of Variance When You Have Independent Data With an Ordinal Variable and a Nominal Variable That Has More Than Two Categories \\ Key Terms \\ Chapter 11 Statistics for Evidence-Based Practice \\ What Is Evidence-Based Practice? \\ Levels of Evidence \\ Statistics for Review of Evidence \\ Some Tips for Reviewing the Evidence \\ Key Terms \\ Key Terms \\ Answers to Quizzes and Review Questions \\ Appendixes \\ References \\ Index
Trade Policy 买家须知
- 关于产品:
- ● 正版保障:本网站隶属于中国国际图书贸易集团公司,确保所有图书都是100%正版。
- ● 环保纸张:进口图书大多使用的都是环保轻型张,颜色偏黄,重量比较轻。
- ● 毛边版:即书翻页的地方,故意做成了参差不齐的样子,一般为精装版,更具收藏价值。
关于退换货:- 由于预订产品的特殊性,采购订单正式发订后,买方不得无故取消全部或部分产品的订购。
- 由于进口图书的特殊性,发生以下情况的,请直接拒收货物,由快递返回:
- ● 外包装破损/发错货/少发货/图书外观破损/图书配件不全(例如:光盘等)
并请在工作日通过电话400-008-1110联系我们。
- 签收后,如发生以下情况,请在签收后的5个工作日内联系客服办理退换货:
- ● 缺页/错页/错印/脱线
关于发货时间:- 一般情况下:
- ●【现货】 下单后48小时内由北京(库房)发出快递。
- ●【预订】【预售】下单后国外发货,到货时间预计5-8周左右,店铺默认中通快递,如需顺丰快递邮费到付。
- ● 需要开具发票的客户,发货时间可能在上述基础上再延后1-2个工作日(紧急发票需求,请联系010-68433105/3213);
- ● 如遇其他特殊原因,对发货时间有影响的,我们会第一时间在网站公告,敬请留意。
关于到货时间:- 由于进口图书入境入库后,都是委托第三方快递发货,所以我们只能保证在规定时间内发出,但无法为您保证确切的到货时间。
- ● 主要城市一般2-4天
- ● 偏远地区一般4-7天
关于接听咨询电话的时间:- 010-68433105/3213正常接听咨询电话的时间为:周一至周五上午8:30~下午5:00,周六、日及法定节假日休息,将无法接听来电,敬请谅解。
- 其它时间您也可以通过邮件联系我们:customer@readgo.cn,工作日会优先处理。
关于快递:- ● 已付款订单:主要由中通、宅急送负责派送,订单进度查询请拨打010-68433105/3213。
本书暂无推荐
本书暂无推荐